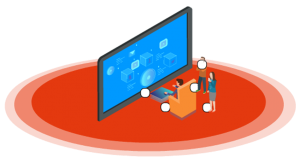

Data visualization is the graphical representation of certain information, facts or data. The different elements of data visualization include charts, maps, figures, and graphs. Data visualization methods are used by different companies to understand market trends, growth rate, and other patterns in the data.
Naturally, human minds are drawn towards vivid colors and patterns. Our mind has the ability to quickly distinguish between different colors, figures, and shapes.
Data visualization is the concept of using visual art to entice and attract the attention of viewers towards a specific message. For instance, whenever we see a bar graph or a chart, we are able to quickly identify the figures depicting trends and outliers. It is our mind that internalizes information quickly.
Data visuals are a type of storytelling techniques with a purpose. Large businesses and corporations from all over the world decipher large volumes of data and carve out important business propositions to display them as impressive data visuals. Furthermore, the data visualization techniques allow us to display the data meaningfully with adequate focus on parameters such as clarity, coherence, and articulatory.
It’s difficult to find an industry that doesn’t use a data visualization technique or a sector where data visualization is redundant. Data visualizations are one of the most useful professional skills to be used in a firm. As a result, companies emphasize the use of data visuals to generate important data analytics pivotal for the growth, sustainability, and development.
Data visualization services help global companies to increase their business intelligence on a large scale by providing information that is vital for decision making and strategy development. Visuals enable you to go in-depth of the findings and assist you in creating effective business plans. Many companies utilize 3D data visualization tools to identify key areas that require immediate attention or improvement and to efficiently predict sales volumes. In addition to that, such visuals help in clarifying the factors that can influence consumer behavior, and help a company with better product placement.
However, it is also important to avoid grandiose visuals and irrelevant pictorial mapping, which confuses the audience and never serve their true purpose. For a big company, visualization is an important tool to validate the enormous amount of data generated every day.
At INAUSCO, we duly understand the requirements of our clients and the scope of using data visualization techniques. We provide our clients with expert services that utilize the best available data visualization software. With our best-in-class expertise, we strive to create effective data visualizations from complex data forms so that your customers can easily understand the message you want to convey.
Our range of services includes creating effective data visualizations which boost up the appeal, retention, and comprehension of data. We understand how data visuals can positively influence your target audience. We create clear, concise, and efficient data visualizations that highlight your message and key elements important for the success of your business.
In addition, our expertise in data visualization stems from our ability to represent crucial data in the best possible way. We take care of each and every parameter, from choosing the right color to selecting the right type of data visualization technique for your brand. The process is not as easy as it sounds, as effective visualizing involves an accurate balancing between form and function. Still, it works both the way as a plain graph could be too boring for the viewer, whereas a stunning visualization could fail to properly convey the message. Hence, it is important that data and visuals are artfully combined with the ability of storytelling to create perfect visualizations.
We ensure that our data visualization services are consistent, thorough, and integrated so that our customers get an interactive experience when using our solutions. Moreover, we provide customizable dashboards with subtle interfaces to provide you an enriched experience while using our data visualization services.